Published September 9, 2026
The system
The dairy is a large operation in central Utah milking about 6,000 cows. Its waste system is a series of holding and treatment ponds that take the manure and wash-down water from the barns, about 200,000 gallons a day of new and recycled water. Effluent from the ponds is pumped back onto the farm for wash-down and cleaning, so the ponds are not a dead end: they are part of the daily water loop. The customer is named in our study document; we publish the name once the dairy confirms it in writing.
The problem
Solids built up in the ponds over time and formed a heavy sludge layer. The sludge clogged the pumps, caused downtime and drove up maintenance costs, and because the pond water is recycled for wash-down, every pump failure reached the barns. The dairy had tried several conventional treatment additives and none had broken the sludge down, which left management skeptical of anything sold as a fix. The scale of the waste stream meant any solution had to run hands-off, with almost no labor from the crew.
What we did
We introduced DRP Accelerator, an inorganic compound that carries usable oxygen to the bacteria already living in the ponds, as a diluted water solution dripped directly into the sludge and slurry ponds every day. No bacteria, enzymes or chemical additives went in. The oxygen let the native aerobic bacteria multiply and break down the organic material in the sludge where it sat. The drip ran continuously after setup and needed no labor from the dairy. The exact dose, the dilution ratio and the pond dimensions are not recorded in the study document.
How it was measured
Two records tell the story. The first is operational: whether the pumps ran, as reported by the dairy’s operations manager. The second is a third-party laboratory that sampled the pond water four times over the treatment period, each round under its own lab identifier: a baseline on March 14, 2025 (lab ID 25C1122-01), then April 3 (25D0378-01), May 7 (25E0534-01) and July 28, 2025 (25G2312-01). The sampling location within the pond system is not recorded in the study document. The laboratory’s name is on the reports and is available on request.
| Parameter | Baseline, Mar 14 2025 | Apr 3 2025 | May 7 2025 | Jul 28 2025 | Units |
|---|---|---|---|---|---|
| Ammonia as N | 33.3 | 9.03 | 7.55 | 185 | mg/L |
| Biochemical oxygen demand (BOD) | 3,660 | 2,520 | 1,020 | 161 | mg/L |
| Chemical oxygen demand (COD) | 6,950 | 3,260 | 1,720 | 710 | mg/L |
| Dissolved organic carbon | 1,870 | 880 | 406 | 85.9 | mg/L |
| Nitrate plus nitrite as total N | 0.41 | 0.880 | ND | 0.418 | mg/L |
| Odor | 1,000 | 2,000 | 2,000 | 1 | T.O.N. |
| Oil and grease (HEM) | 27 | 8 | 7 | ND | mg/L |
| pH | 6.8 | 7.2 | 7.6 | 8.2 | pH units |
| Sulfate | 47.9 | 9.55 | 6.70 | 34.2 | mg/L |
| Total dissolved solids (TDS) | 3,400 | 2,900 | 2,500 | 2,500 | mg/L |
| Total Kjeldahl nitrogen (TKN) | 425 | 141 | 214 | 217 | mg/L |
| Total suspended solids (TSS) | 1,160 | 232 | 200 | 151 | mg/L |
| TRPH (SGT-HEM) | ND | ND | ND | ND | mg/L |
| Phosphorus, total as P | 70.2 | 30.2 | 2.5 | 18.1 | mg/L |
ND means not detected. T.O.N. is threshold odor number, the dilution needed before a panel can no longer smell the sample.
Results
Within three months the compact sludge had broken down, and the pumps ran reliably again without clogging or overstrain. The operations manager told us it was the first product that worked as promised after multiple unsuccessful attempts with other additives. The lab series shows the biology behind that: BOD fell from 3,660 to 161 mg/L over four months, COD from 6,950 to 710 mg/L, total suspended solids from 1,160 to 151 mg/L, dissolved organic carbon from 1,870 to 85.9 mg/L, and oil and grease from 27 mg/L to non-detect. Odor went up before it went down, from 1,000 to 2,000 T.O.N. in the second and third rounds and then to 1 in the fourth. That rise is the cleanup period: as the accelerated bacteria break up years of settled deposits, the water carries more of it for a while before it settles cleaner than it started. The drip system needed virtually no labor beyond setup.
Limitations
This is one dairy under its own conditions, with no untreated pond for comparison. The pump outcome is the operations manager’s report, not a logged series of run hours or clog events. The lab table is four grab samples over four months, and the sampling point and the dose are not recorded in the study document. Not every parameter moved one way: ammonia as nitrogen fell through the first three rounds and then rose to 185 mg/L in the fourth, and TKN rose from its low point. Ammonia in a manure pond swings with loading, temperature and how nitrogen is being converted, and a single sample cannot say why. We report it because a table with the awkward row left in is worth more than one without it. A dairy with a different herd, bedding, water loop or climate should expect a different timeline and a different set of numbers.
Proof assets
- The study document describing the system, the problem, the daily drip and the outcome.
- The third-party laboratory table above, with lab identifiers and dates, and the reports behind it available on request.
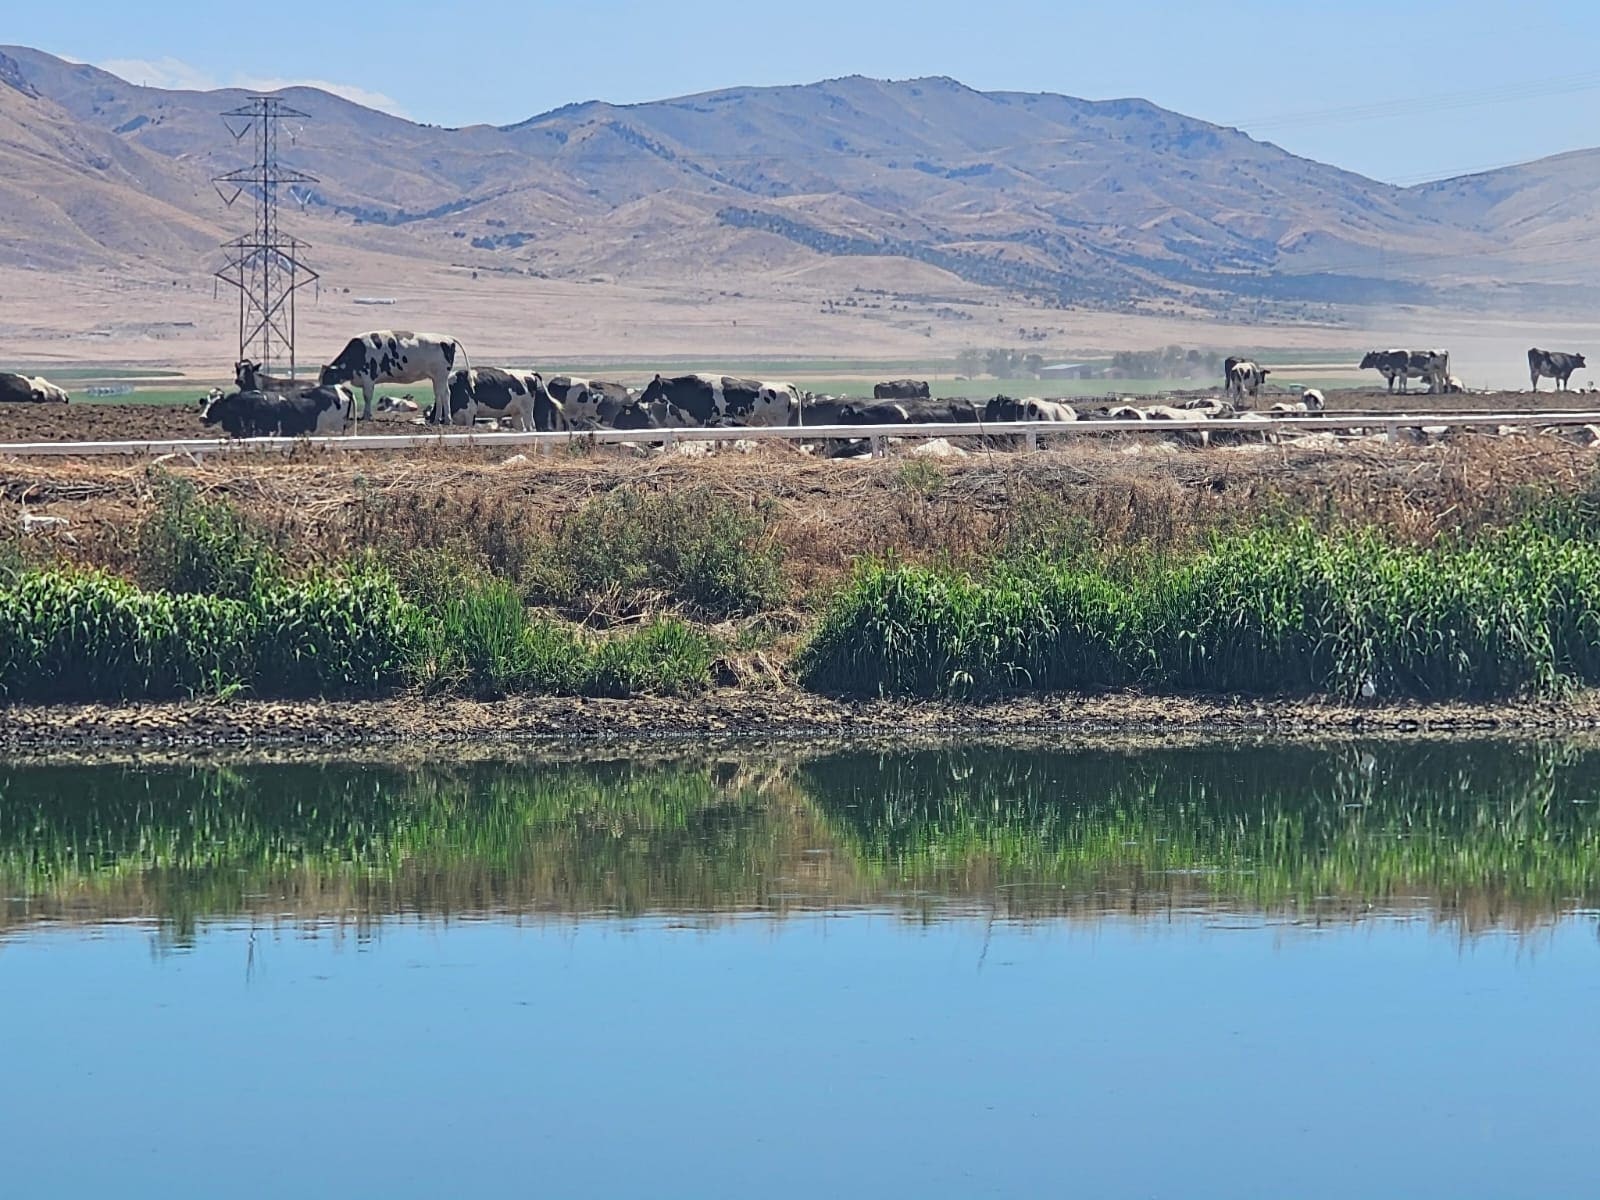
- A photo of the lagoon after treatment (above). Before photos and the dairy’s own video are being added.
- The customer’s written permission to publish its name is being confirmed by Waste Water Innovations.