
Published September 24, 2026
The system
This case looks at a laboratory bacteria growth test, not a wastewater installation. Two 1 quart jars were filled with the same untreated well water from an East Texas well drawn from a depth of about 180 feet. Each jar received 900 milliliters of water, 90 grams of raw sugar as a food source, and 45 grams of a dry Bacillus and Pseudomonas culture. One jar also received DRP Accelerator, the inorganic oxygen carrier we dose into wastewater systems to prevent hydrogen sulfide (H2S) from forming, mixed in at 10 percent of the jar’s water volume. The other jar received no accelerator and served as the untreated blank. Both jars were sealed, shaken, and left undisturbed at about 70 degrees Fahrenheit for five days.
The problem
DRP Accelerator’s mechanism in a wastewater system rests on a simple premise: bacteria that have usable oxygen available to them do not need to strip it from sulfate, and they can put their energy into growing and breaking down organic material instead. This test set out to check that premise directly, outside of a wastewater system, using a controlled bacteria culture instead of a live sewer or lagoon. With the water, sugar, and starting bacteria count held identical between the two jars, the only variable was whether the jar had usable oxygen available to it in the form of DRP Accelerator.
What we did
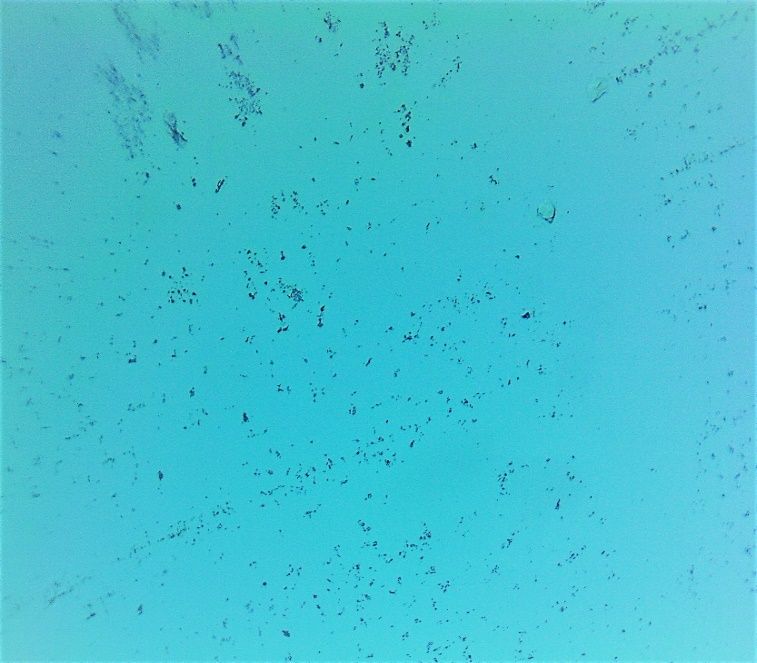
We filled two 1 quart jars with the same untreated East Texas well water, then added DRP Accelerator to only one of them, at 10 percent of the jar’s water volume. Both jars received 90 grams of raw sugar and 45 grams of a dry Bacillus and Pseudomonas culture. We sealed and shook both jars, then let them sit undisturbed at about 70 degrees Fahrenheit. At intervals over five days we compared the two jars by eye, drew a sample from each, and searched a microscope slide from each jar for the area with the highest number of bacteria or the largest individual bacteria, photographing that area each time.
How it was measured
The record is a visual and microscopic one, not a bacteria plate count. At each interval we compared the two jars by eye for color and for the depth of the dark, settled layer forming at the bottom of each jar, then photographed the densest or largest bacteria found on a slide from each jar, at ten times magnification through day four and forty times magnification on day five, when the microscope’s color filter was changed from blue to yellow to sharpen the image. The four to eight times and forty to one hundred times figures below are visual estimates from comparing slides side by side, not a laboratory cell count. The test ran once, over five days, with no repeat run and no plate count to confirm the visual estimates.
Results
| Interval | Observation |
|---|---|
| Two hours | No visible difference between the two jars; used to record baseline photos |
| Day one | Accelerator jar visibly darker than the blank; an estimated four to eight times more bacteria on the slide, with visibly larger individual cells |
| Day two | Accelerator jar still slightly darker; a dark settled layer forming at the bottom of both jars, larger in the accelerator jar; bacteria on the accelerator slide still visibly larger |
| Day three | Same color difference continues; the dark settled layer in the accelerator jar almost twice the size of the blank’s |
| Day four | Same color difference continues; the dark layer holding at about twice the blank’s; report estimates forty to one hundred times more bacteria in the accelerator jar |
| Day five | At forty times magnification, individual bacteria in the accelerator jar appear larger than those in the blank |
The report’s stated conclusion is that DRP Accelerator increased both the number of bacteria present and the size of individual bacteria, and that using it to strengthen a bacteria population should help any application where bacteria are relied on to break down organic material.
Limitations
This is a laboratory growth test on an added bacteria culture with a sugar food source, not a test run in wastewater, so it demonstrates the oxygen supply mechanism rather than a treatment outcome. The bacteria counts are visual estimates made by comparing microscope slides side by side, not a laboratory plate count or any other quantitative cell count. The test ran once, with no repeat run to confirm the estimates. The source document does not name who ran the test, the exact date it took place, or the specific strains within the Bacillus and Pseudomonas culture used. For a future customer, a result like this is a goal we measure, not a promise.
Proof assets
- The study document, “Bacteria Growth Test,” with its microscope photographs from the two hour baseline through day five.
- The two microscope photographs above, from that document.
- This is a controlled laboratory comparison, not a customer site, so no customer name is at issue on this page.